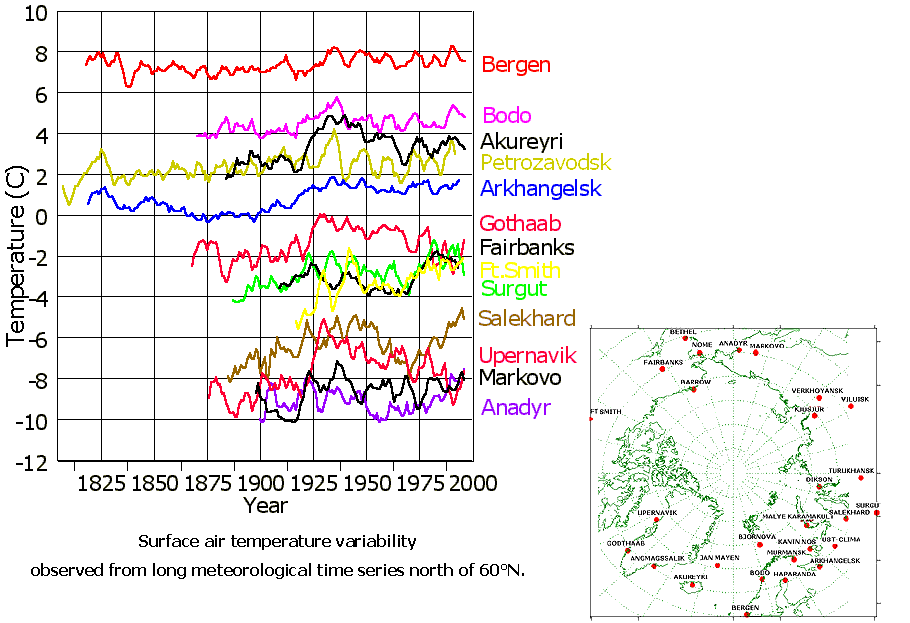
Table contains a complete list of stations whose data are included to the archive with indication of the station number according to the WMO Catalogue, coordinates and operation period. Surface air temperature data available for the Arctic indicate substantial fluctuations in the high northern latitudes on decadal to multi-decadal time scales, including pronounced two warm periods: the 1920s-1940s (2) and since the 1970s (3). The Map shows the station locations of some of the longest meteorological time series, Fig.1 indicates their temporal variability. To see a table, containing liner trends of surface air temperature for the meteorological stations with longest observational records, please click here: Trends. The 1920s-40s warm period is evident in these station data, as is the warming in recent decades. The warming trends are greater further north and over land areas, whereas one area (e.g., coastal western Greenland) has actually cooled since the 1970s. To see a description of the variability and trends of the arctic air temperature in the perspective of climate change, please click here: arctic temperature variability.

Fig.1.
Surface air temperature variability at some stations north of 60o N.
1. Aleksandrov Ye.I., Dementyev A.A., (1995): Surface meteorological database
of polar regions and its use. In: Formation of the database on sea ice and
hydrometeorology. St. Petersburg: Gidrometeoizdat, p. 67-75.
2. J. Hansen, S. Lebedeff, J. Geophys. Res. 92, 13345 (1987).
3. P. Jones, M. New, D. E. Parker, S. Martin, I. G. Rigor, Rev. Geophys.
37, 173 (1999).