Multifractal analysis of the time series
Contents
The multifractal analysis is the extension of fractal analysis. It was introduced
to science by Mandelbrot (see [1]). Also the description of multifractal analysis
could be found in [2]. The multifractal characteristics provide most complete
characterisation of scaling properties of self-similar distributions. The inhomogeneity
of any self-similar distribution is completely described by the spectrum of
generalized fractal dimensions or multifractal spectrum. The comparison of multifractal
characteristics of two different distributions can provide an information about
difference in inhomogeneity of these distributions, about difference of scaling
properties, about the degree of order and chaos in the natural systems, which
generated these distributions. Description of multifractal analysis can be downloaded as pdf
file. Software modules with the description can be downloaded as zip
file. [1] Mandelbrot, B. (1989) Multifractal Measures, Especially for the Geophysicist,
PAGEOPH, 131, 6-41. [2] Feder, J. (1988) Fractals., Plenum Press, New York. Here the results are presented of processing of the data of the river outflow
for 5 Russian rivers. The outflow data exist for every month in the certain
time limits for each river.
|
River name |
Period |
|
|
Dvina |
1881 |
1988 |
|
Kolima |
1927 |
1989 |
|
Lena |
1935 |
1993 |
|
Ob |
1930 |
1993 |
|
Pechora |
1932 |
1987 |
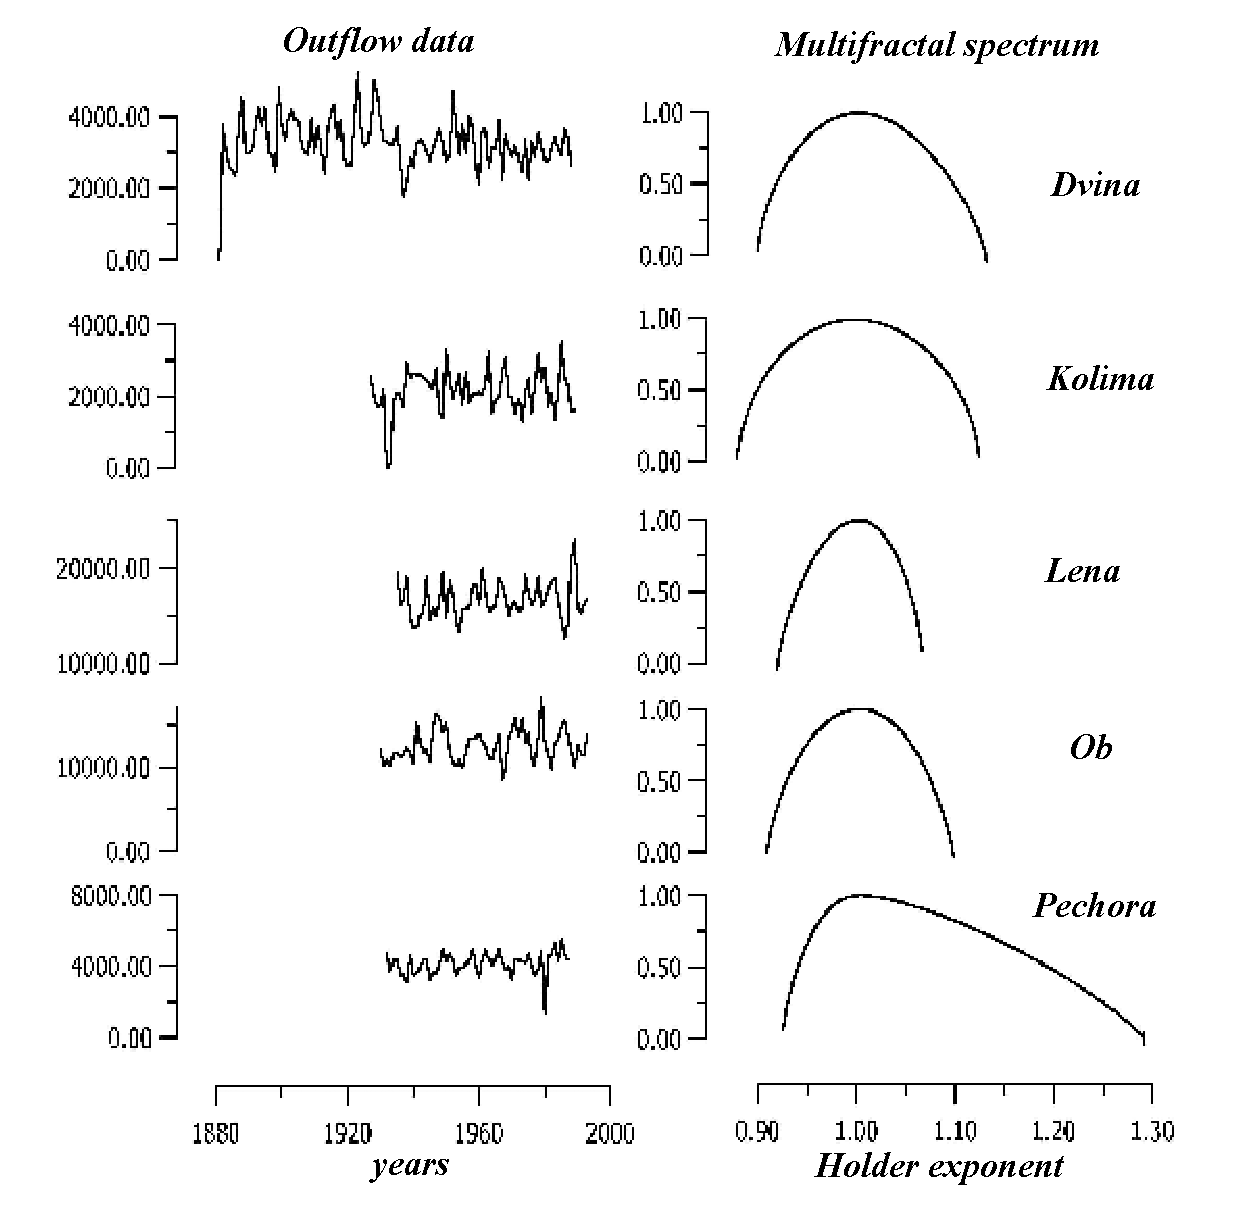
The multifractal tool was applied for river outflow time series analysis. The time series of mean annual outflow were processed for each river. Each time serie was normalized and then it was treated as the measure distribution in the temporal interval. The multifractal spectrums were computed for each time serie. The results of calculations are presented below.

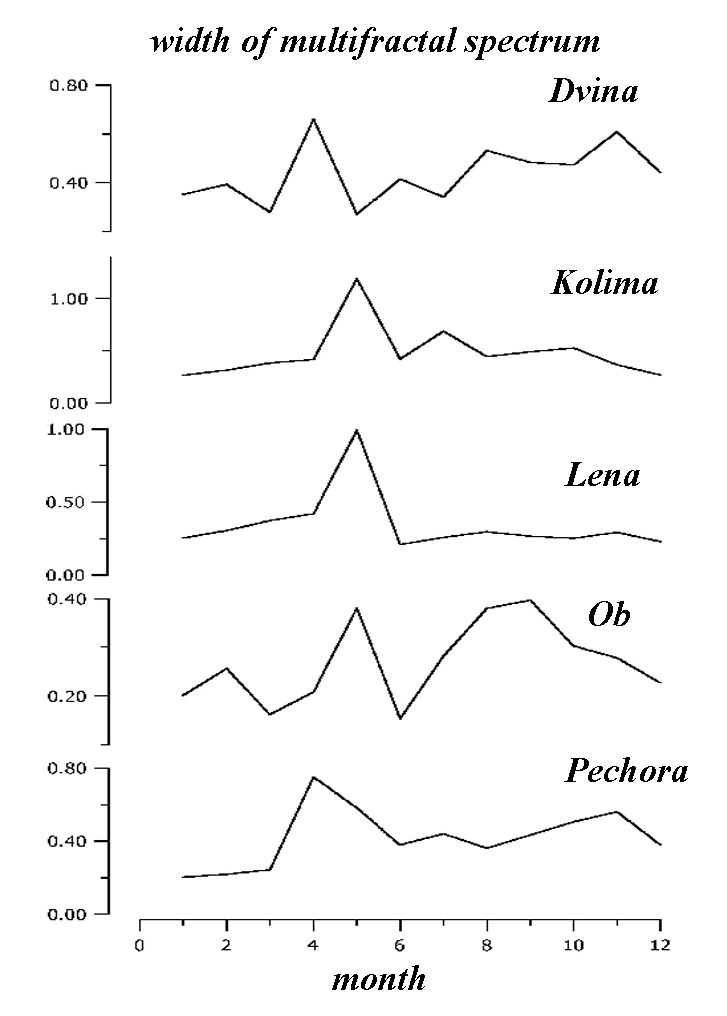
Besides processing of time series of mean annual river outflow, the processing was performed of the time series of monthly outflow values. Such time series were composed for each particilar month. The multifractal spectrums were calculated for the time series of monthly outflow values for each river. The width of the multifractal spectrum is defined as the difference of maximal and minimal Holder exponents. The dependence of the width of multifractal spectrum on the month is shown below for each river.

It can be seen that the multifractal spectrum tends to be wider for smaller rivers. The edges of the multifractal spectrum contain the information about distribution of the extremal values of multifractal measure. So, the outflow of smaller rivers is more variable in a wide range of temporal scales. Their regime is more unstable and sensitive to the influence of external factors. The width of the multifractal spectrum tends to have a peak for the time series, calculated for the April-May time period. The instability of the outflow regime at this period is linked to snow melting.