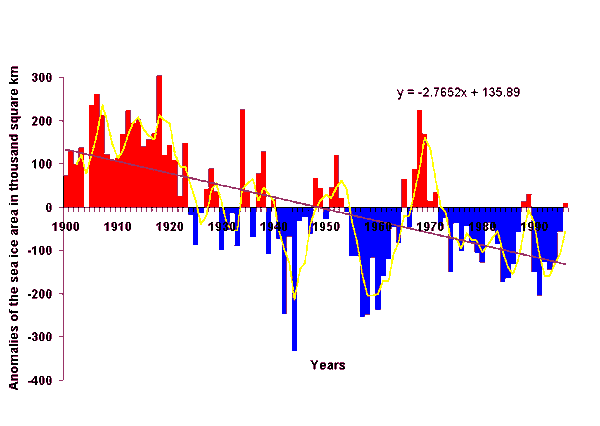
The variability of sea ice extent in the Arctic Ocean is characterized by an obvious regional peculiarity. In the central part of the ocean occupying the entire near-pole area up to the boundaries of the marginal seas, the seasonal and multiyear changes are not pronounced at all. This is the area of the so-called “perennial” ice whose core is comprised of multiyear and second-year ice. Beyond this area (in the marginal part of the ocean, which includes all seas), the seasonal and multiyear variability in sea ice extent is pronounced, but its character to the west and east of Novaya Zemlya is different. West of the archipelago, i.e. in the North-European Basin where the conditions for unhindered horizontal development of sea ice are preserved the year-round, the seasonal and interannual differences in ice area are most pronounced (Fig.1, fig.2). To the east of Novaya Zemlya, in the Kara, Laptev, East-Siberian and Chukchi Seas that are completely ice-covered from November to May, these differences are manifested only in the summertime (Fig.3-6, correspondingly). The contribution of some seas to dispersion of sea ice area changes in the Arctic Ocean is presented in Table 1.
Table 1|
Region |
X |
XI |
XII |
I |
II |
III |
IV |
V |
VI |
VII |
VIII |
IX |
|
EG |
24 |
43 |
55 |
56 |
52 |
51 |
42 |
35 |
29 |
26 |
11 |
11 |
|
B |
43 |
57 |
45 |
44 |
48 |
49 |
58 |
65 |
58 |
39 |
15 |
12 |
|
K |
24 |
0 |
0 |
0 |
0 |
0 |
0 |
0 |
9 |
18 |
22 |
17 |
|
L |
2 |
0 |
0 |
0 |
0 |
0 |
0 |
0 |
3 |
10 |
24 |
21 |
|
ES |
4 |
0 |
0 |
0 |
0 |
0 |
0 |
0 |
4 |
11 |
26 |
34 |
|
Chw |
2 |
0 |
0 |
0 |
0 |
0 |
0 |
0 |
-3 |
-4 |
2 |
5 |
It follows from the Table that the contribution of the Siberian portion of the ice "pancake" to the total dispersion of the total Arctic ice area changes is comparatively small, while the contribution of East-Greenland and Barents Sea ice is overwhelming. In the mean annual expression, the share of the latter comprises 80% of dispersion. This means that the character and the depth of the climatic scale changes in the sea ice extent in the Arctic Ocean observed in the 20th century is mainly governed by the ice formation and melting processes in the North-European Basin.
The dominating significance of this basin in the variability of sea ice extent is clearly manifested in the values of linear trend parameters β. It is specifically noted that the horizontal development of sea ice in the Arctic Ocean was throughout the 20th century under the sign of the decrease of its area. The intensity of this decrease, on average, for a year expressed by β comprised 56 thousand km2/decade. In the North European Basin, it was 48 thousand km2/decade and in the Siberian arctic waters, it equaled 8 thousand km2/decade.
It should be noted that the secular trends indicate a rather generalized picture of sea ice area changes. A more detailed understanding can be gained taking into account the natural intra-secular stages of their development consistent with the changes in the thermal state of the atmosphere. Four such stages were identified in the 20th century: two stages of the ice cover expansion in the Arctic Ocean (1900-1918 and 1939-1968) and two stages of its reduction (1918-1939 and 1968-1999). Each of these stages is characterized, on average, for a year by the following trend parameters: β=+169 in 1900-1918, 200 in 1918-1939, +25 in 1939-1968 and 121 thousand km2/decade in 1968-1996.
To investigate the features of trend manifestation within a year everywhere where it was possible, their parameters for each month were also derived in the framework of the development stages (Table 2).
Table 2
Parameters of linear trend β of sea ice area in the Arctic Ocean by the stages
of the stages of development (thousand km2/decade)
|
Period |
1900-1918 |
1918-1938 |
1946-1968 |
1968-1996 |
|
October |
|
|
|
-77 |
|
November |
|
|
|
-34 |
|
December |
|
|
|
-76 |
|
January |
|
|
|
-104 |
|
February |
|
|
|
-118 |
|
March |
|
|
|
-150 |
|
April |
+121 |
-134 |
+6 |
-173 |
|
May |
+187 |
-164 |
+44 |
-182 |
|
June |
+182 |
-116 |
+124 |
-143 |
|
July |
+195 |
-342 |
+198 |
-154 |
|
August |
+239 |
-431 |
+188 |
-141 |
|
September |
|
|
|
-107 |
|
Mean annual |
+169 |
-200 |
+122 |
-122 |
As can be seen from the data contained in the Table, the ice extent trend does not change its sign during the year. However, its inclination expressing the intensity of ice cover decrease or expansion depending on the sign, experiences significant seasonal variations. The lowest values of parameter β are noted in autumn and the most significant in spring and summer. However, this conclusion requires further checking being so far of a preliminary character.

Fig.1. Deviations of the annual from the mean for XX Century East-Greenland sea ice areas
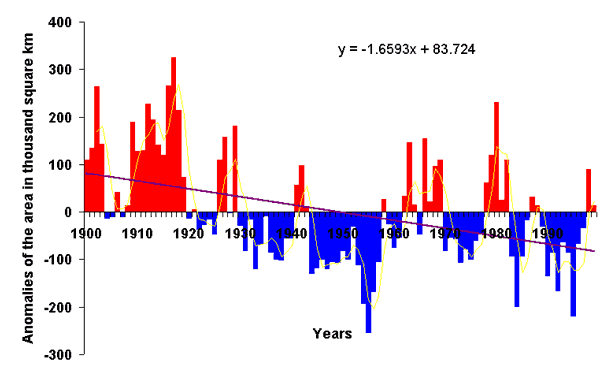
Fig.2. Change of the deviations from the mean of the annual ice area in the Barents Sea in XX century
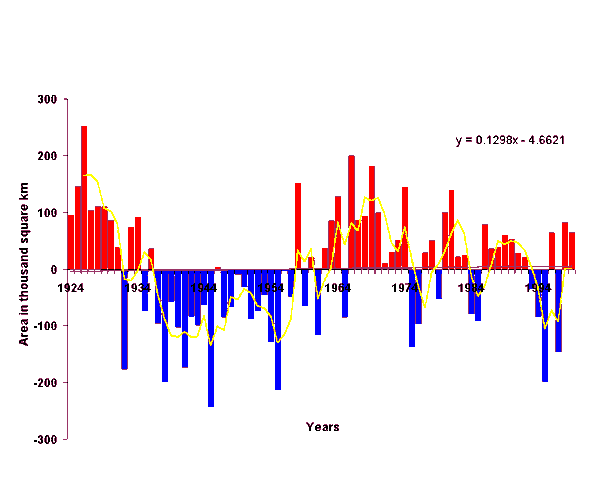
Fig.3 Deviations of the average for June-October from the mean sea ice area in the Kara Sea
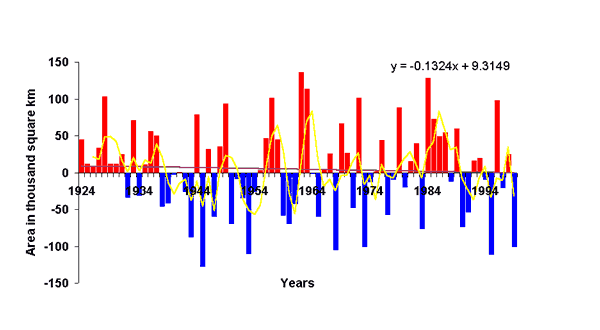
Fig.4. Deviations of the average for June-October from the mean sea ice area in the Laptev Sea
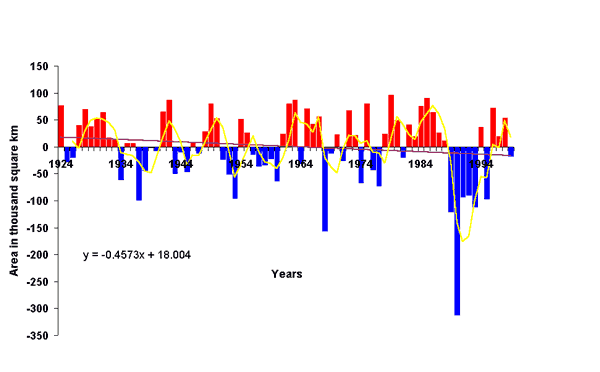
Fig.5. Deviations of the average for June-September from the mean sea ice area in the East-Siberian Sea
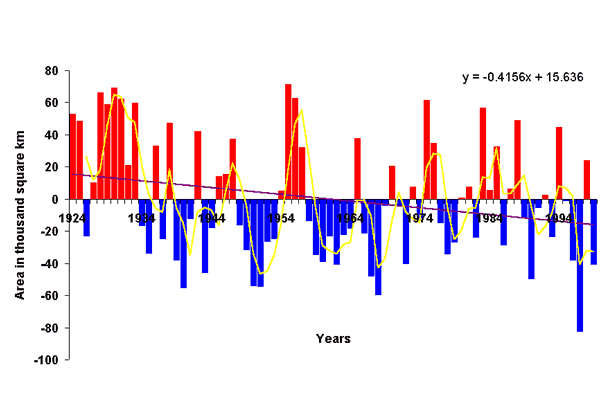
Fig.6. Deviations of the average for June-October from the mean sea ice area in the western part of the Chukchi Sea