Correlation analysis of the air temperature changes in the north hemisphere
Description of method
The correlation analysis was used in order to study the temporal changes of
the structure of climatic subsystem of the northern hemisplere. The method is
based on calculation of correlation coefficients between the spatial distributions
of mean annual temperatures for different years. Study of temporal variability
of these coefficients provide information about changes in climatic system.
The average year temperature is defined as T(i,k) for the year i
on the station k. Then, a vector T(i)={T(i,1), T(i,2),…, T(i,28)}
was introduced. The correlation coefficient between the components of vectors
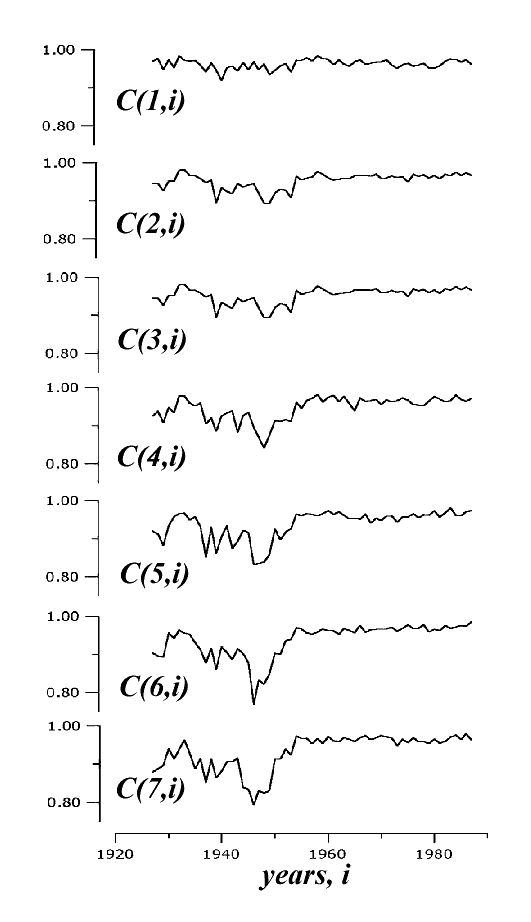
T(i) and T(i+n) was assigned as C(n,i) . The study of
the temporal variations of C(n,i) detect the changes in the climatic
subsystem. Software modules with the description can be downloaded as zip file.
Analysis of the air temperature variability
The monthly mean temperature data from 28 stations in the north hemisphere had been used for analysis. The selected records started from 1927 year, and finished by 1996 year. The temporal variations of the correlation coefficients C(n,i) are shown below. It is evident, that the correlation coefficient tend to decrease in the period 1940-1955. It tells us about the changes in climatic system in this period.
